Find all documents and resources here
News & Press Releases
Read our news, press releases and monthly production statistics below
03 Jun 2026
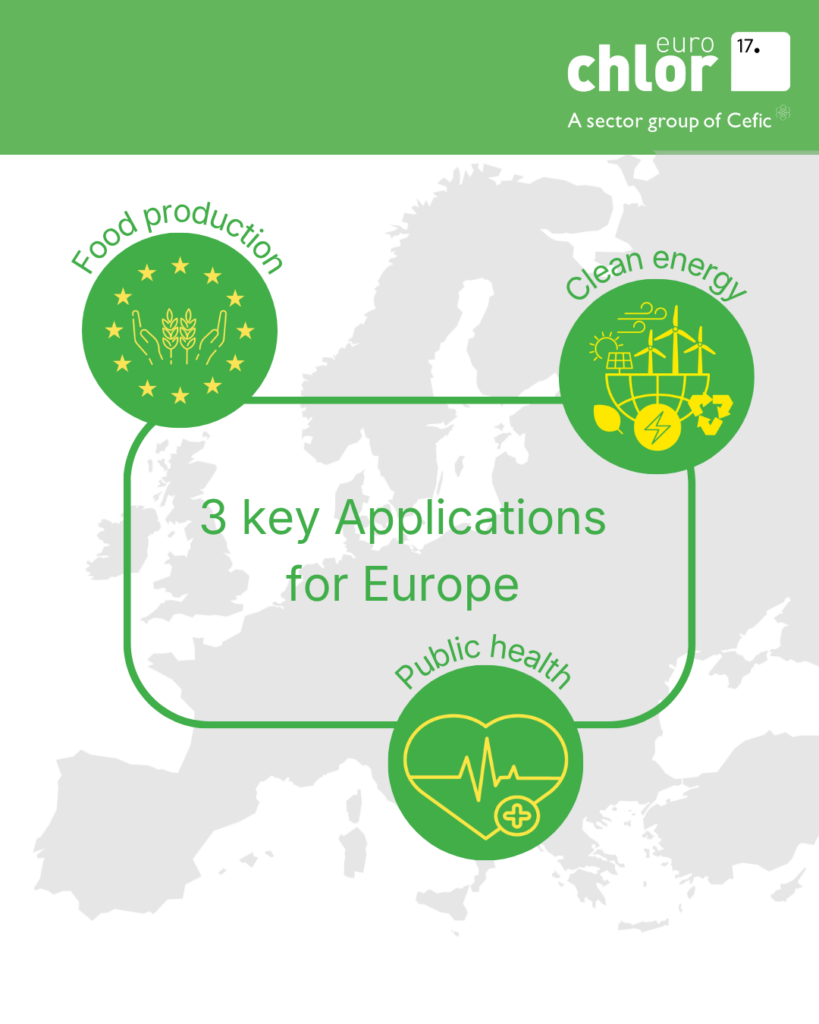
New video on the Challenges of making three Critical Connected Chemicals
02 Jun 2026
April 2026 Chlorine production
05 May 2026
March 2026 Chlorine production
23 Apr 2026
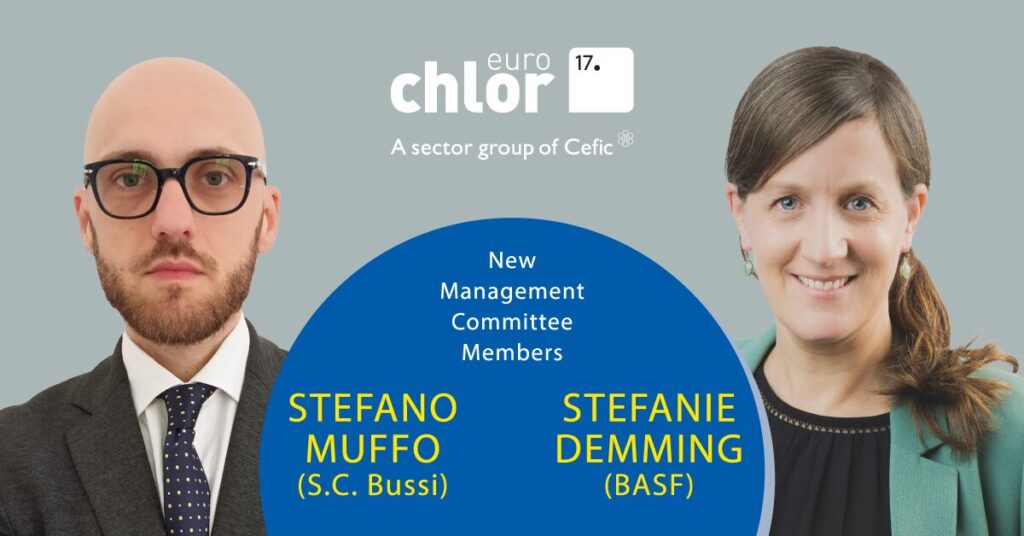
Two new members join the Euro Chlor Management Committee
23 Apr 2026
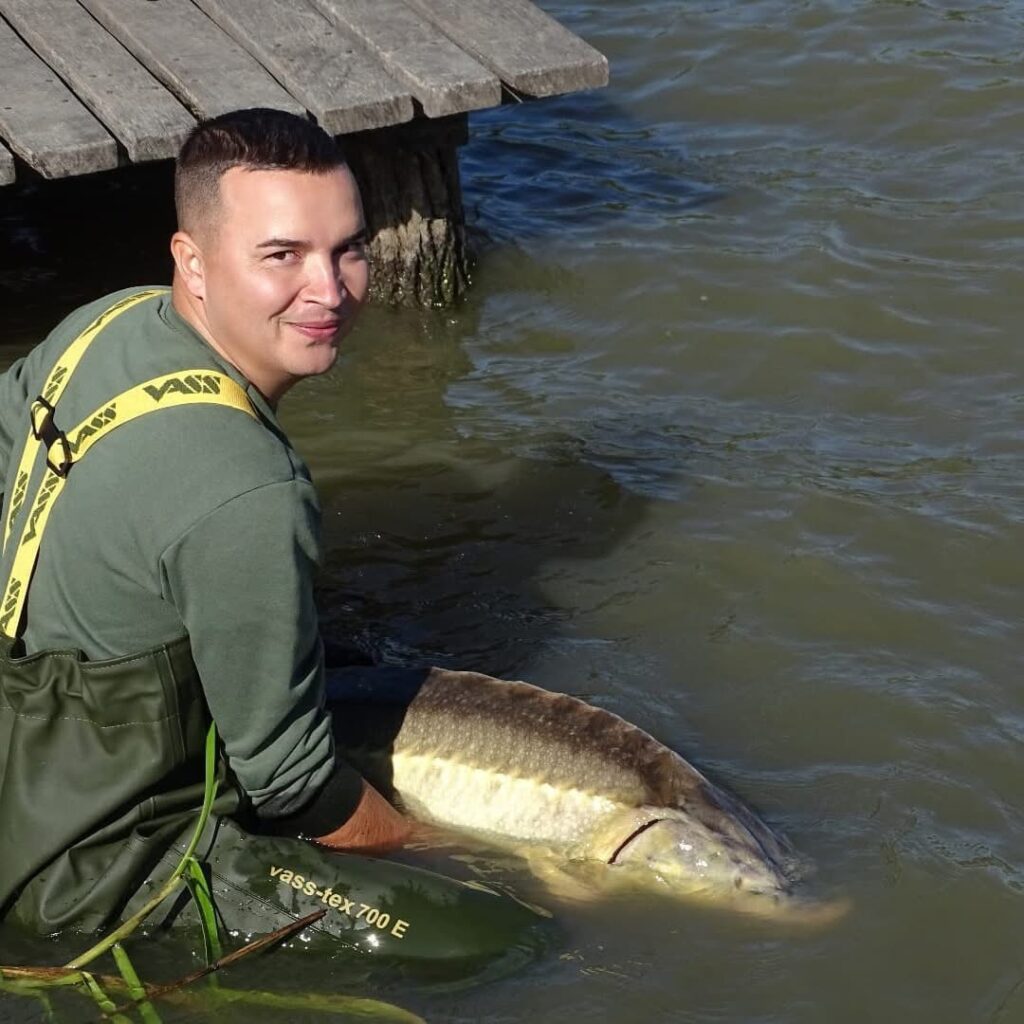
The angler: Chlor Alkali innovations behind modern fishing
20 Apr 2026
Euro Chlor appoints new interim Management Committee Chair
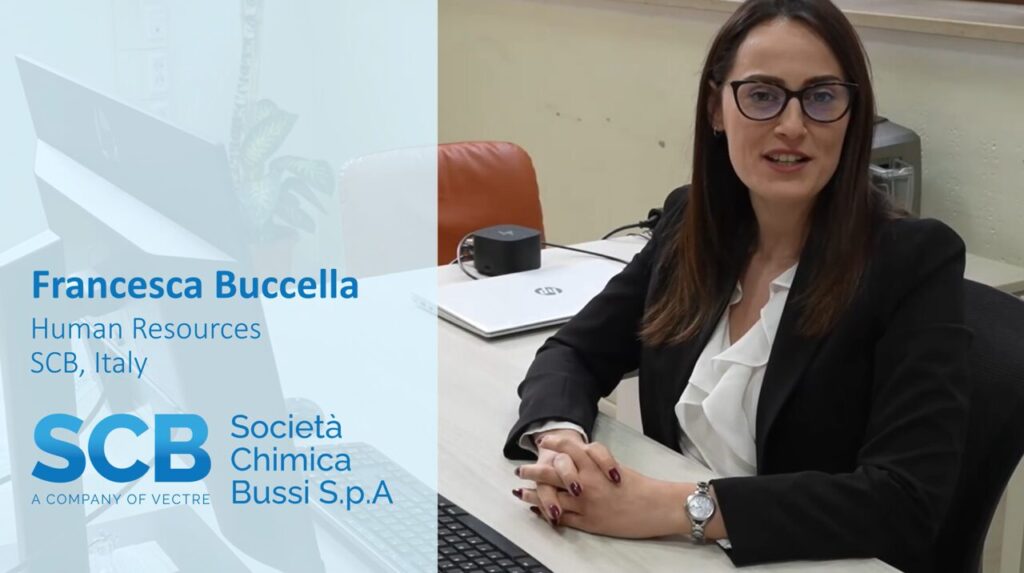
07 Apr 2026
Francesca Buccella from Società Chimica Bussi features as sixteenth 17 Chlor-Alkali Careers interviewee
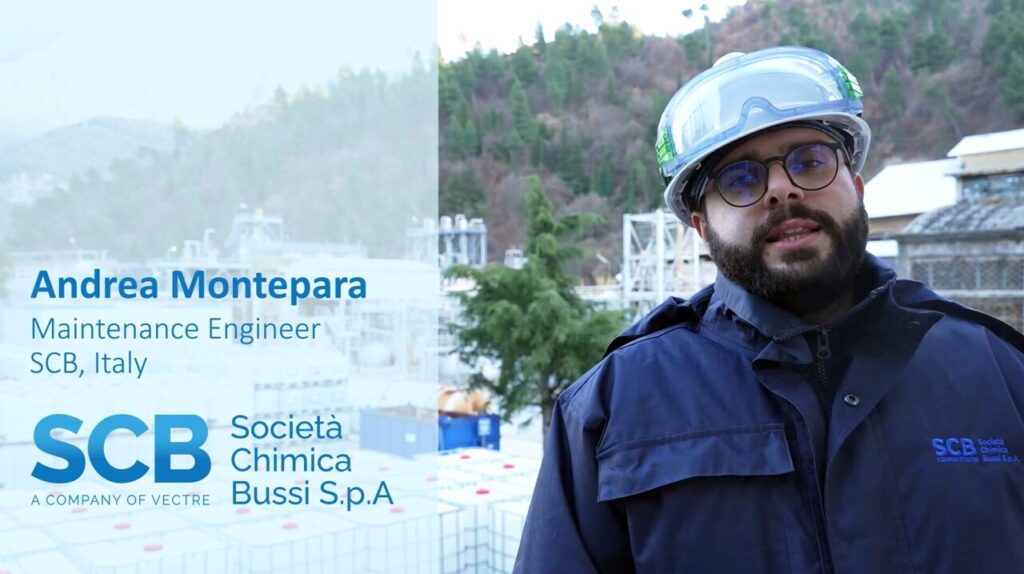
07 Apr 2026
Andrea Montepara from Società Chimica Bussi features as fifteenth 17 Chlor-Alkali Careers interviewee
03 Apr 2026
February 2026 Chlorine production
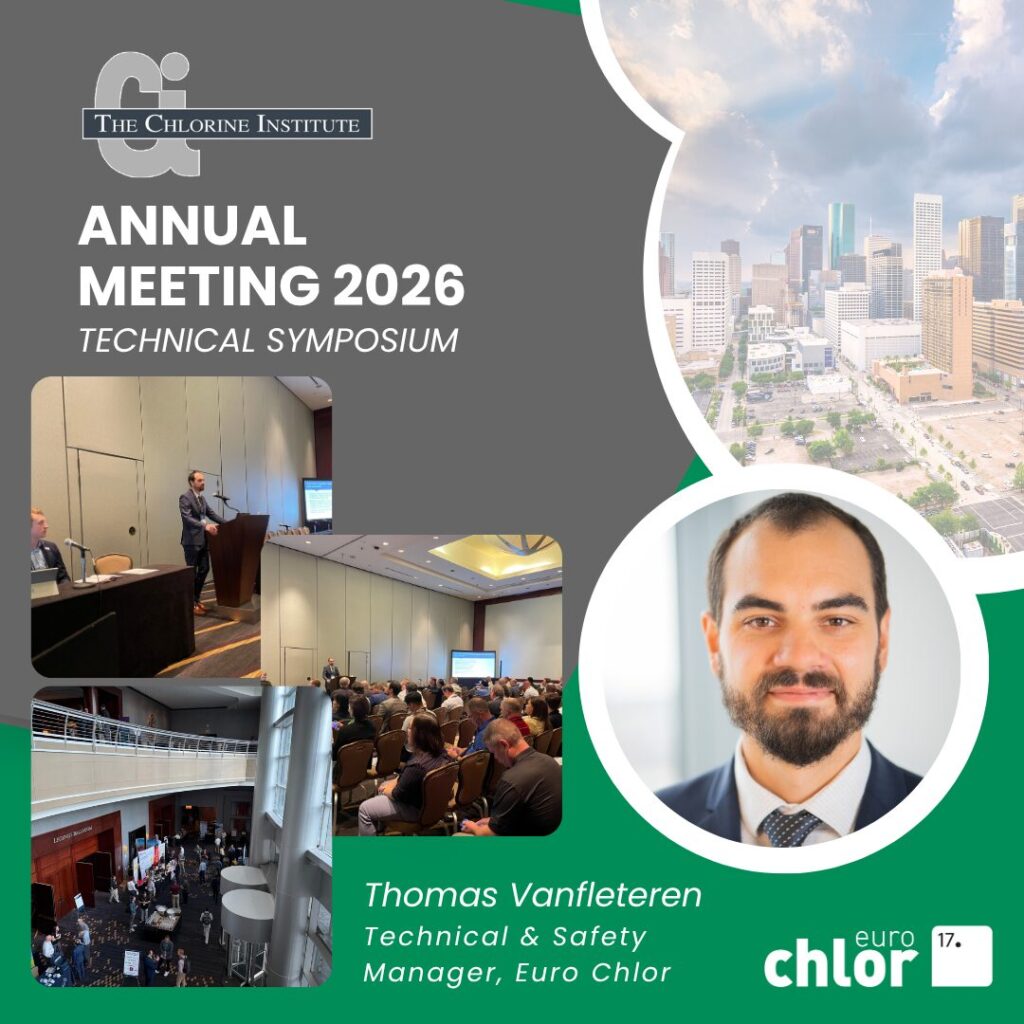
02 Apr 2026
Euro Chlor at the Chlorine Institute 2026 Annual Meeting: technical, safety and regulatory insights
01 Apr 2026
January 2026 Chlorine production
01 Apr 2026
Why Europe needs local production of Chlorine
20 Feb 2026
December 2025 Chlorine production
20 Feb 2026
November 2025 Chlorine production
18 Feb 2026
October 2025 Chlorine production
24 Nov 2025
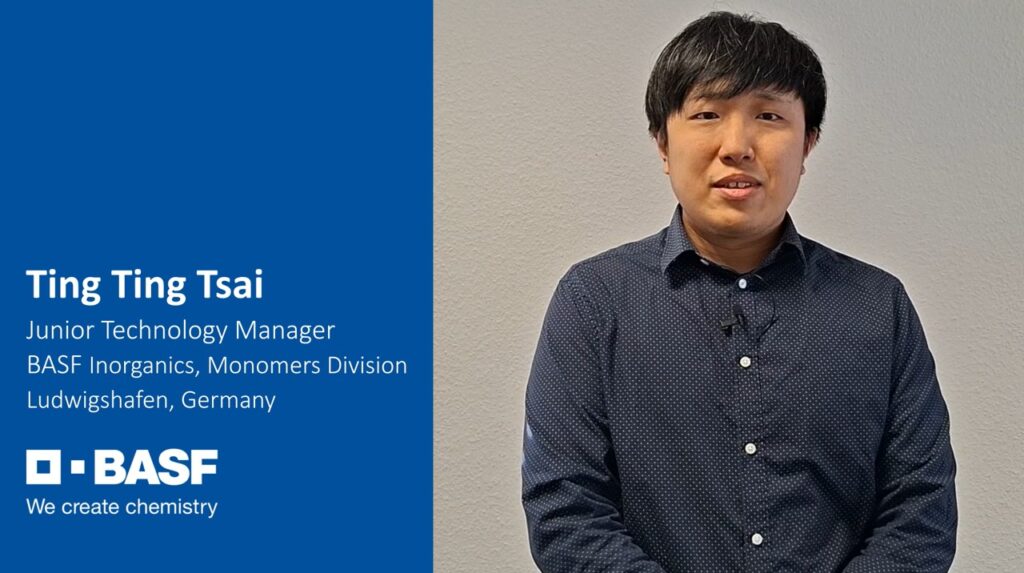
Ting Ting from BASF features as fourteenth 17 Chlor-Alkali Careers interviewee
07 Nov 2025
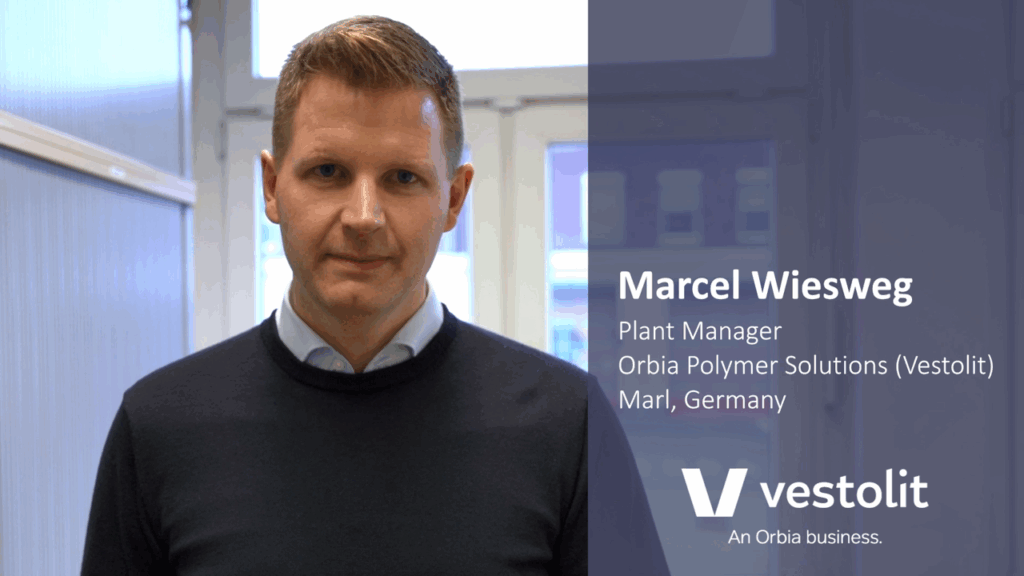
Marcel from VESTOLIT features as thirteenth 17 Chlor-Alkali Careers interviewee
04 Nov 2025
September 2025 Chlorine production
02 Oct 2025
August 2025 Chlorine production
23 Sep 2025
New Chair welcomed for Euro Chlor Statistics Committee
